Why Illustrated Ads Win Under Meta's Andromeda Algorithm [2026]
Meta's Andromeda update groups visually similar ads into a single learning signal. Illustration produces truly diverse creatives at near-zero marginal cost — here is how to apply it and why brands like Hollow Alpaca Socks are testing 15 illustration styles with one headline.
Every performance marketer has done this: taken a product photo, duplicated it ten times, slapped ten different headlines on it, and called that a creative test. In 2024, that worked. In 2026, it does not.
Meta’s Andromeda update changed how the algorithm evaluates creative. The system now groups ads with shared visual and thematic features and treats them as a single learning signal. Ten headlines on the same image are not ten tests — they are one test with one visual signal and ten wasted ad sets.
The implication is structural: if you want the algorithm to treat each creative as a genuinely new opportunity, each creative needs to look genuinely different. Not different text. Different visuals.
Illustration — generated by AI for a few dollars per image — is the fastest way to achieve that diversity. Here is why, and how brands are already exploiting it.
How Andromeda Changed the Creative Game
Before Andromeda, Meta’s ad delivery system evaluated each creative independently. Upload five variations and the algorithm tested each one against your audience as a separate experiment. The result: marketers could scale creative volume by making small changes — new headline, new CTA color, slightly cropped image — and each variation got its own chance.
Andromeda introduced creative grouping. The system identifies ads that share common visual features — the same background photo, similar color palette, matching composition — and clusters them. Within a cluster, the algorithm learns from the group, not the individual ad. The practical effect: your “ten variations” might actually be two or three groups, each competing for the same audience slot.
Meta’s own December 2025 post on creative diversification confirmed the mechanism. The system “groups ads with common visual and thematic features and learns from them as if they were a single creative.” New text on the same image changes nothing from the algorithm’s perspective. The visual backbone is what the system reads first.
This is why practitioners now say “creative is the new targeting.” With Advantage+ campaigns and broad audiences, the algorithm handles distribution. The only lever you control is what the audience sees. And under Andromeda, the only way to actually expand what the audience sees is to give the algorithm visually distinct creatives — not text swaps on identical images.
Why Illustration Beats Photography for Creative Diversity
If visual diversity is the new currency, the question becomes: what is the cheapest, fastest way to produce it?
Photography requires a new shoot for every meaningfully different visual. Different model, different setting, different lighting, different composition. A single photo shoot that produces one usable style costs $500-$3,000. Getting four visually distinct styles means four shoots.
Illustration flips the economics. One product concept rendered in four illustration styles — anatomical diagram, pencil sketch, flat cartoon, 3D claymation — produces four creatives that Andromeda treats as four separate signals. The cost per AI-generated illustration: under $5. The time per variation: minutes.
Three structural advantages make illustration the optimal format for Andromeda:
Infinite style variation. The same product benefit — “graduated compression helps blood flow” — looks completely different as a medical anatomy diagram versus a chalkboard sketch versus a Pixar-style 3D render. Each style triggers a different visual processing pathway in the viewer’s brain, and each one registers as a distinct creative to the algorithm.
Near-zero marginal cost. Once you have the prompt structure for one style, producing the same concept in a new style costs one API call. Scaling from 5 to 15 illustrated variants costs less than a single stock photo license.
No production dependencies. No photographer, no studio, no model release forms, no weather-dependent outdoor shoots. A strategist with access to Midjourney or Flux can generate a full style matrix in an afternoon.
For brands already investing in AI creative production, this is a natural extension. The same tools and skills that produce AI cartoon ads and animated marketing content generate illustrated statics with the same workflow.
What Hollow Tested: One Text, Fifteen Illustrations
Hollow Alpaca Socks — a DTC compression sock brand — ran one of the clearest public tests of this strategy. On October 23, 2026, they launched approximately 15 illustrated static ads on Meta. Same product. Same core message. Same offer. Fifteen different illustration styles.
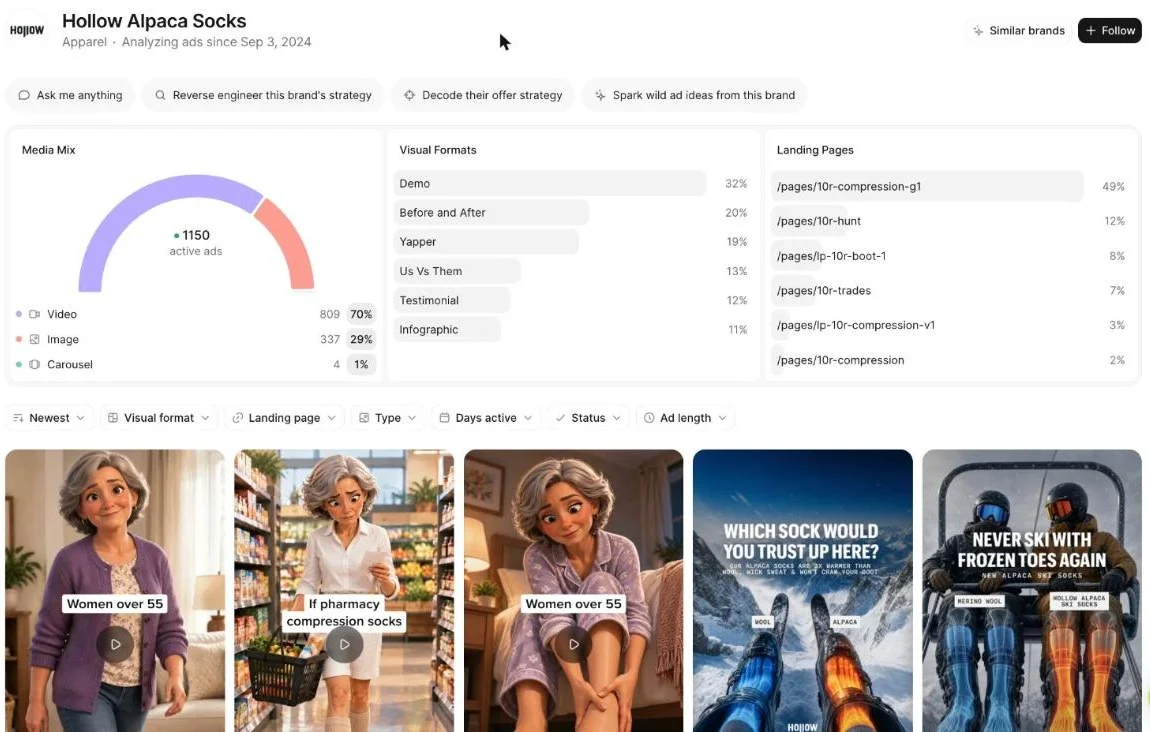
The styles they tested:
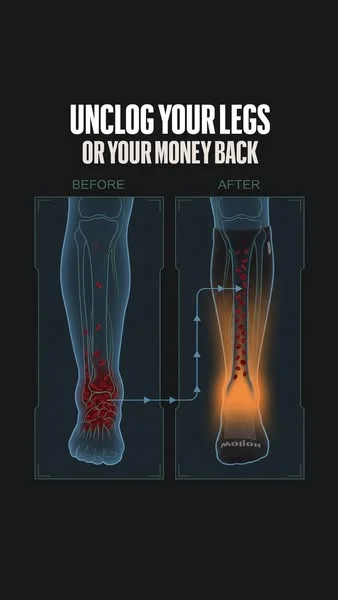
1. Anatomy and blood flow diagrams. Medical-style illustrations showing blood pooling in legs and graduated compression pushing it upward. Almost clinical — looks like a textbook illustration, not an ad. Headlines: “Your socks should be pushing the fluid up,” “Graduated compression helps blood flow back up.”
2. Pencil sketch, engraving style. Hatched ink drawings with a hand-drawn, scientific feel. Communicates expertise and authority without looking like marketing. The same compression mechanism, rendered as if from a vintage anatomy textbook.
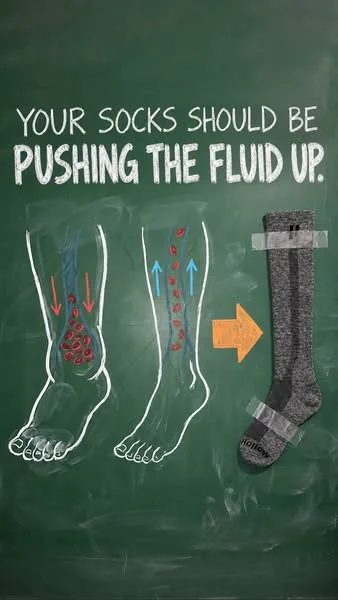
3. Chalkboard drawings. Green background, white chalk-style sketches with arrows showing fluid direction. The “let me explain this simply” format — educational, approachable, and visually distinct from everything else in a feed.
4. Flat 2D cartoon characters. Simplified human figures showing progression — puffy ankles to normal ankles in 3-4 frames. Reads instantly. Not medical, not scientific — just clear visual storytelling.
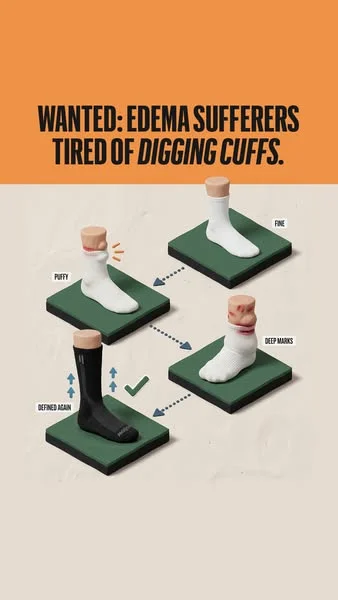
5. 3D claymation renders. Volumetric feet on display stands, soft studio lighting. Looks like a premium product render from a luxury brand. The same compression message, but the visual language says “premium” instead of “medical.”
6. Four-panel comic strips. Sequential storytelling: tight socks dig in → swelling → graduated compression → relief. The format forces a reading order, increasing time spent on the ad.
7. Carousel hybrids. Photo of a real person as the first frame, then illustrated mechanism diagrams in the middle slides, product shot at the end. Combines the trust of a real face with the explanatory power of illustration.
8. Product schematics. Cross-section diagrams showing where the sock reinforces, where it bunches, where it applies pressure. Technical, practical, comparison-focused.
As of November 5, 2026, these illustrated statics had been in rotation 9 to 19 days — too early to call winners, but long enough to see that multiple styles survived the algorithm’s initial screening. The key insight: Hollow used the same text across all styles, isolating the visual as the only variable. This is textbook creative testing methodology — one variable at a time.
Illustrated Statics vs UGC: The Rotation Data
Illustration is not a replacement for UGC. It is a diversification layer. The rotation lifespan data tells you why:
| Format | Brand | Days in Rotation | Takeaway |
|---|---|---|---|
| Illustrated statics | Hollow | 9-19 | Fresh test, winners not proven yet |
| UGC situational photos | Hollow | up to 40 (median 40) | Longest-running compression statics in Ad Library |
| Long-running statics (Motion data) | Hollow | 60-366 | 133 active compression statics rotate 60+ days |
| Raw phone photos + long story | One Compress, Koprez | 100-212 | Hold longer in niche |
| Bright lifestyle founder photos | Not Your Grandma’s (UK) | 26-30 | Only notable UK brand using this visual style |
The conclusion: UGC holds longer because the algorithm has years of data proving it converts. Illustrated ads are new to most accounts, so Andromeda is still learning what works. But the strategic play is not to replace UGC with illustrations — it is to add illustrated variants alongside UGC so the algorithm has more distinct visual signals to test against more audience segments.
Strong brands like Hollow run both. Their most durable statics are situational UGC photos. Their newest experiment is illustrated statics. The illustrated variants expand the visual surface area the algorithm can explore without cannibalizing what already works.
How to Apply This: The Style Matrix
Here is the practical framework for running your own illustrated ads under Andromeda:
Step 1: Pick Your Best-Performing Text
Take your top 3 ad headlines and body text combinations by CPA. These are your controls — proven messages that already convert. Do not write new copy. The point is to test visual style, not messaging.
Step 2: Build a Style Matrix
For each message, generate the visual in 4-6 illustration styles:
| Style | Visual Language | Best For |
|---|---|---|
| Medical / anatomical diagram | Clinical, educational, trustworthy | Health, wellness, supplements, compression |
| Pencil sketch / engraving | Expert, vintage, authoritative | Authority claims, scientific products |
| Chalkboard explanation | Simple, approachable, educational | Mechanism-of-action products |
| Flat 2D cartoon | Friendly, clear, quick to read | Mass-market products, progression stories |
| 3D claymation / Pixar | Premium, playful, visually rich | Premium positioning, gifting, lifestyle |
| Comic strip / sequential | Narrative, engaging, high dwell time | Before/after, problem-solution |
Step 3: Generate with AI
Use Midjourney, Flux, or any image generation tool. The prompt structure: describe the product mechanism first, the visual style second, and the composition third. “Graduated compression pushing blood upward in a human leg, medical anatomy diagram style, dark background, labeled arrows” produces a usable static in one generation.
For batch production, API access cuts the cost to under $1 per image. Six styles of one concept: under $6.
Step 4: Launch and Isolate
Run all style variants with identical text, identical offer, identical audience. Spend $50-$100 per variant before judging. The performance differences are attributable to the visual style — giving you clean data on what visual language your audience responds to under Andromeda’s grouping logic.
Step 5: Scale Winners, Expand the Matrix
The style that wins becomes your primary illustration format. Produce 10-20 variations in that style to feed the algorithm volume. Then repeat with the next-best-performing style for audience expansion. This is the same creative testing cycle that drives every OKAD engagement — research, test, iterate — applied to visual format rather than messaging.
Why This Matters for Ad Fatigue
Andromeda’s grouping behavior compounds the ad fatigue problem. When the algorithm clusters similar creatives, fatigue hits the entire cluster — not just one ad. Your audience gets tired of the visual pattern, and every ad in that cluster declines simultaneously.
Illustrated style diversity breaks this pattern. Each illustration style occupies a different visual cluster. When the anatomy diagrams fatigue, the chalkboard sketches are still fresh. When the flat cartoons fatigue, the 3D renders are still earning attention. Instead of one creative lifespan, you get four or six — each running on its own fatigue clock.
This is the same principle behind hook swaps and format remixes, applied at the visual style level. The message stays constant. The visual wrapper changes. The algorithm treats each wrapper as a new creative. Fatigue resets.
How OKAD Applies This
When Olga Kad and the OKAD team build creative testing roadmaps for clients, visual style diversity is now a first-order variable — not an afterthought. The Andromeda update made it impossible to scale by producing the same visual in volume. The framework changed:
Phase 1: Audit the client’s existing creative library and tag each ad by visual cluster. Most accounts have 80% of their spend concentrated in 1-2 visual styles.
Phase 2: Identify the 3-4 illustration styles that fit the product category. For health and wellness, that usually means anatomy diagrams, flat cartoon explainers, and 3D renders. For apps and software, it means UI mockups, icon-style illustrations, and character-driven scenes.
Phase 3: Generate the style matrix — same proven text, 4-6 visual styles — and launch as a structured test. The results tell us which visual language the audience responds to, not just which message works.
Phase 4: Feed winners to production. The winning illustration style becomes a permanent creative format in the rotation, produced at volume alongside UGC and live-action.
The brands that will win on Meta in 2027 are the ones that treat visual diversity as seriously as they treat messaging. Andromeda rewards accounts that give the algorithm more visual signals to explore. Illustration — fast, cheap, infinitely varied — is how you do that without multiplying your production budget.
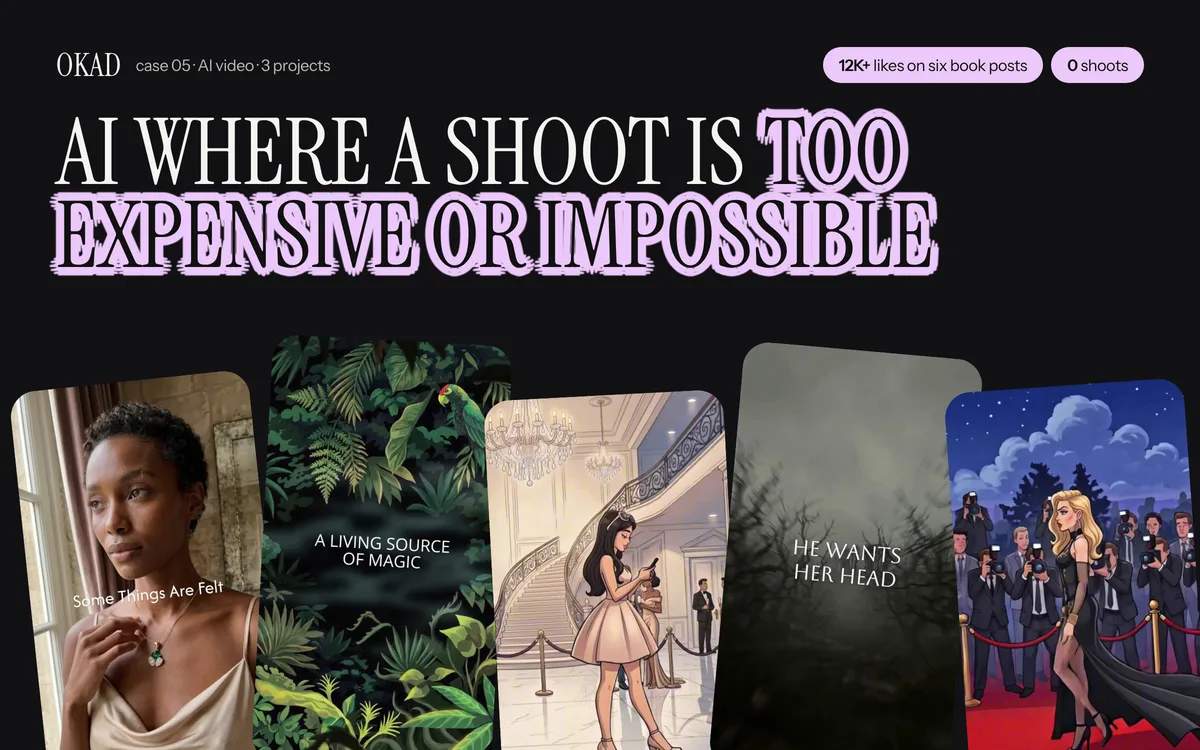
OKAD produces illustrated ad creatives across all 8 styles — from a single brief to a full style matrix ready for testing. See the full case study.
Work With OKAD
OKAD produces illustrated and animated ad creatives as part of a full creative strategy service — research, briefs, production, and testing in one retainer. No per-asset pricing. No retainer lock-in.
See pricing and book a call · Or email olga@okad.agency with your monthly ad spend and goals.
Questions people ask
What is Meta's Andromeda algorithm and how does it affect ads?
Andromeda is Meta's creative ranking system that groups ads with similar visual and thematic features and learns from them collectively. If you upload ten ads that share the same background photo with different text overlays, Andromeda treats them as variations of one creative — not ten independent tests. This means visual diversity between ads matters more than ever. Each ad needs to look structurally different for the algorithm to treat it as a genuinely new signal.
Why do illustrated ads perform better under Andromeda?
Illustrated ads give you infinite visual diversity at near-zero marginal cost. An anatomy-style illustration, a chalkboard sketch, a 3D claymation render, and a flat cartoon — even with identical text — are four visually distinct creatives that Andromeda treats separately. Achieving the same diversity with photography would require four completely different photo shoots with different styles, models, and settings.
How many illustration styles should I test per ad text?
Start with 4 to 6 styles. A practical starter set: anatomical or medical diagram, pencil sketch or engraving, chalkboard drawing, flat 2D cartoon, 3D claymation render, and a comic panel layout. Each style reads as a completely different ad to both the algorithm and the viewer. Run all variants with the same text and offer so performance differences are attributable to the visual style alone.
How long do illustrated ads last in rotation compared to UGC?
Data from Meta Ad Library shows illustrated statics are too new to have proven longevity — current tests show 9 to 19 days in rotation. UGC situational photos from the same brands last up to 40 days. Long-running statics can survive 60 to 366 days. Illustrated ads are best understood as a diversification play that feeds the algorithm fresh visual signals, not as a replacement for proven UGC formats.
Can I make illustrated ads with AI tools or do I need a designer?
AI image generation tools like Midjourney and Flux produce illustration styles that are ready for ad use. A single prompt with the right style keywords — claymation, pencil sketch, medical diagram, flat vector — generates a usable static in minutes. The cost per illustrated static is under five dollars when using API-based generation. The skill that matters is knowing which styles to test and how to write clear prompts, not drawing ability.