Cartoon Ads vs UGC: Which Ad Format Lasts Longer? [2026 Data]
Real rotation data comparing illustrated cartoon ads to UGC photo and video ads. How long each format survives before fatigue, why they fatigue differently, and how to build a format mix that keeps your ad account healthy.
Every brand running paid social eventually asks the same question: should we invest in cartoon and illustrated ads, or stick with UGC?
The answer from the data is clear — and it is not what either camp expects. Cartoon ads and UGC ads do not compete. They serve different functions in an ad account, fatigue through different mechanisms, and solve different problems. The brands scaling fastest in 2026 run both, and the format mix is what separates healthy ad accounts from ones trapped in a constant fatigue cycle.
Olga Kad and the OKAD team track competitor ad libraries weekly as part of the creative strategy cycle. The data below comes from that ongoing competitive analysis — real rotation numbers from brands spending significant budgets on Meta, not theoretical benchmarks.
How Ad Longevity Works
Before comparing formats, it helps to understand what “days in rotation” actually measures.
When an ad launches on Meta, the algorithm distributes it to a test audience. If engagement signals are positive — clicks, saves, shares, video views — the algorithm expands distribution. The ad stays in rotation as long as it continues generating positive signals relative to other ads in the account.
Ad fatigue is the point where those signals decline. The audience has seen the ad enough times that engagement drops. CTR falls, frequency rises, and CPA climbs. The ad is still technically running, but it is no longer profitable.
Days in rotation — from launch to the point where the ad is either paused by the advertiser or deprioritized by the algorithm — is the most practical measure of creative longevity. An ad that holds rotation for 60 days at a profitable CPA is worth more than an ad that performs brilliantly for 5 days and dies.
The Data: Longevity by Format
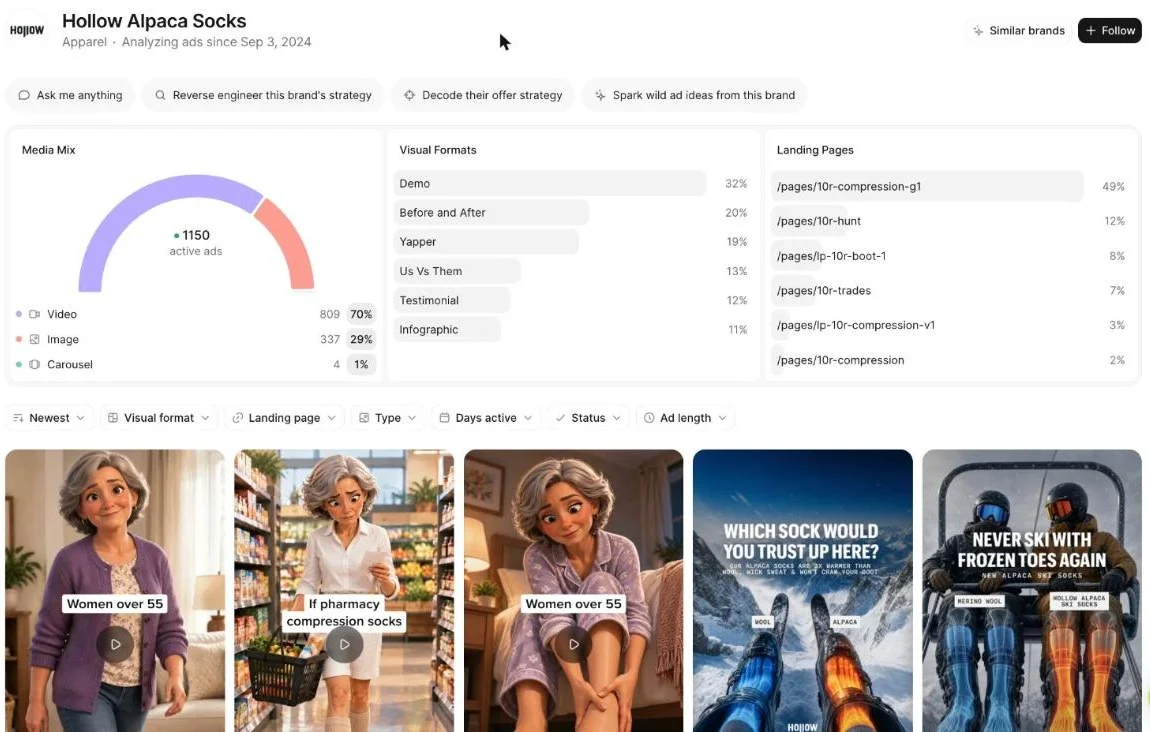
OKAD’s competitive analysis tracks active ads across categories using Meta Ad Library and Motion. Here is what the rotation data shows for the compression wear category — a market where multiple brands test illustrated formats heavily alongside UGC.
| Format | Brand | Days in Rotation | Notes |
|---|---|---|---|
| Illustrated statics (cartoon, anatomy, chalk) | Hollow Alpaca Socks | 9-19 days | Launched Oct 2026, fresh test batch |
| UGC situational photos (travel, commute) | Hollow Alpaca Socks | Up to 40 days (median ~40) | Longest-lived statics in the account |
| Long-running statics (mixed formats) | Hollow Alpaca Socks | 60-366 days | 133 active; includes older UGC and product shots |
| Raw phone photos + long caption stories | One Compress, Koprez | 100-212 days | Competitors using low-production personal stories |
| Bright lifestyle founder photos | Not Your Grandma’s (UK) | 26-30 days | High-quality but shorter rotation than raw UGC |
Hollow Alpaca Socks runs roughly 1,150 active ads — 70% video, 29% images, 1% carousel. Their visual format breakdown: demos 32%, before/after 20%, talking head 19%, us-vs-them 13%, testimonial 12%, infographic 11%. The illustrated statics are the newest addition to an already diverse creative portfolio.
The pattern is consistent: illustrated ads rotate for shorter periods than established UGC formats, but they fill a role that UGC cannot.
Why Cartoon Ads Fatigue Differently
Cartoon and illustrated ads earn attention through visual novelty. In a feed dominated by real-world footage — faces, products, lifestyle shots — an illustration creates a pattern interrupt. The brain registers something visually distinct and pauses to process it.
This is exactly the mechanism described in our cartoon ad production guide: the format itself earns attention before the message lands.
The problem with novelty-driven attention is that novelty has a half-life. Once someone has seen your illustrated anatomy diagram or chalk-sketch ad three times, the novelty is spent. The ad no longer looks different from everything else — it looks like something they have already seen.
Three factors accelerate cartoon ad fatigue:
Style convergence. When one brand finds success with an illustrated style, competitors copy it within weeks. The Pixar-3D look that felt fresh six months ago now appears across dozens of brands. What was a pattern interrupt becomes visual wallpaper.
Audience saturation. Illustrated formats often reach a narrower effective audience than UGC. The pattern interrupt works on people who notice visual novelty — a subset of your total addressable audience. Once that subset has been reached at sufficient frequency, the ad has nowhere new to go.
No trust accumulation. A UGC ad featuring a real person builds cumulative trust each time someone sees it. An illustrated ad does not. Repeated exposure to a cartoon provides diminishing novelty without increasing trust — pure fatigue with no offsetting benefit.
Why UGC Still Holds for Direct Response
UGC ads earn attention through a fundamentally different mechanism: relatability and social proof. A real person describing their experience with a product triggers trust signals that no illustration can replicate.
This is why UGC situational photos — someone wearing compression socks while traveling, at their desk, during a morning run — hold rotation for 40+ days while illustrated ads from the same account fatigue in under 20. The relatability signal does not expire the way novelty does.
The competitive data reinforces this. Brands like One Compress and Koprez run raw phone photos with long personal captions — visually unpolished, production cost near zero — and hold rotation for 100-212 days. The content earns trust through authenticity, and authenticity ages slowly.
For brands comparing the two formats across product categories, our AI video ads vs UGC analysis breaks down which categories favor which format and why.
The Winning Strategy: Visual Format Diversity
The insight from OKAD’s competitive research is not that cartoon beats UGC or vice versa. It is that format diversity is the strategy.
After Meta’s Andromeda algorithm update, the ad platform groups visually similar ads and treats them as variations of one creative. Ten photos of the same product from slightly different angles look like one ad to the algorithm. This means producing more of the same format delivers diminishing returns — the system wants visual variety, not volume within one style.
Illustration solves this problem directly. A cartoon anatomy diagram, a chalk-sketch explanation, and a flat-vector infographic are each visually distinct from every UGC video in the account. The algorithm treats each as a genuinely different ad, which means broader distribution and more data per test.
Hollow’s approach demonstrates this: they test illustrated statics across eight distinct visual styles — anatomy diagrams, pencil sketches, chalkboard drawings, flat cartoon people, 3D claymation renders, 4-panel comics, photo-plus-illustration carousels, and product schematics. Each style reads as a unique creative to the algorithm. Combined with their UGC and video portfolio, the visual diversity keeps the account’s effective creative volume far higher than the raw ad count suggests.
The practical framework:
| Format Category | Role in Account | Recommended Share |
|---|---|---|
| UGC video and photo | Trust, social proof, direct response | 50-60% |
| Illustrated and cartoon statics | Pattern interrupt, reach, algorithm diversity | 20-30% |
| Hybrid (cartoon hook + UGC body) | Best of both — novelty opening, trust closing | 10-20% |
This is not a fixed ratio. Test it for 30 days, then reallocate based on which formats drive the lowest CPA in your account. Some audiences respond more strongly to illustration; others are almost entirely UGC-driven. The creative testing methodology OKAD runs with every client isolates format as a variable in the first testing round.
When to Add Cartoon to Your Creative Mix
Three signals indicate that illustrated ads will improve your account:
1. UGC fatigue is outpacing production. If your best UGC ads die every 2-3 weeks and your creator pipeline cannot keep up, cartoon fills the gap. A single designer with AI tools can produce 10-20 illustrated ad variations per day — a velocity no UGC pipeline matches.
2. Your category is visually homogeneous. If every competitor runs the same UGC talking-head format, an illustrated ad in the feed is an immediate pattern interrupt. The less illustration your category uses, the more effective it will be for you.
3. Your product benefit is invisible. Compression, supplements, skincare actives, financial products — anything where the value happens beneath the surface or over time. Illustration can show blood flow, absorption, internal mechanisms, and before/after progressions that cameras cannot capture. This is why Hollow’s anatomy-style illustrations work: they visualize graduated compression pushing fluid upward — a benefit that is impossible to photograph.
How OKAD Tests Format Mix
When Olga Kad onboards a new client, the first creative audit includes a format diversity assessment. The question is not “are the ads good” — it is “how many visually distinct ad types does the algorithm see?”
An account running 50 UGC videos that all feature a creator talking to camera has, algorithmically, far less creative diversity than an account running 20 ads across five distinct visual styles.
The OKAD testing process for format mix follows the same creative strategy framework used for angle and hook testing:
Week 1-2: Audit existing creative. Catalog every format in rotation. Identify format gaps — which visual styles have never been tested.
Week 3-4: Produce a test batch with 3-5 illustrated variations alongside the ongoing UGC pipeline. Same messaging angles, different visual execution. This isolates format as the variable.
Week 5-6: Read the data. If illustrated ads beat UGC on CTR but lose on conversion rate, the format works for top-of-funnel but not direct response. If they beat on both, scale the format. If they lose on both, the audience does not respond to illustration — move on.
Ongoing: For accounts where illustration works, add it to the permanent creative rotation. Produce new illustrated styles every 2-3 weeks to stay ahead of style fatigue. The production cost is minimal — AI tools have collapsed cartoon ad production to $100-$500 per batch, versus $500-$2,000 for equivalent UGC.
The campaign that demonstrates this best is Skribly’s 1,257-video program, which achieved 8%+ retention rates by mixing formats systematically — not by finding one winning format and running it until it died.
The Bottom Line
Cartoon ads do not replace UGC. UGC does not make cartoon unnecessary. They fatigue through different mechanisms, serve different audience responses, and fill different roles in an ad account.
The data is unambiguous: illustrated ads rotate for shorter periods (9-40 days) but cost almost nothing to replace. UGC holds longer (40-200+ days) but requires creator production timelines. The brands winning on Meta in 2026 are not choosing between them — they are running both, tracking longevity by format, and reallocating budget toward whatever the data says is working this month.
If your ad account runs one format — any one format — you are leaving performance on the table. Add a visually distinct format to your next creative test and let the numbers decide.
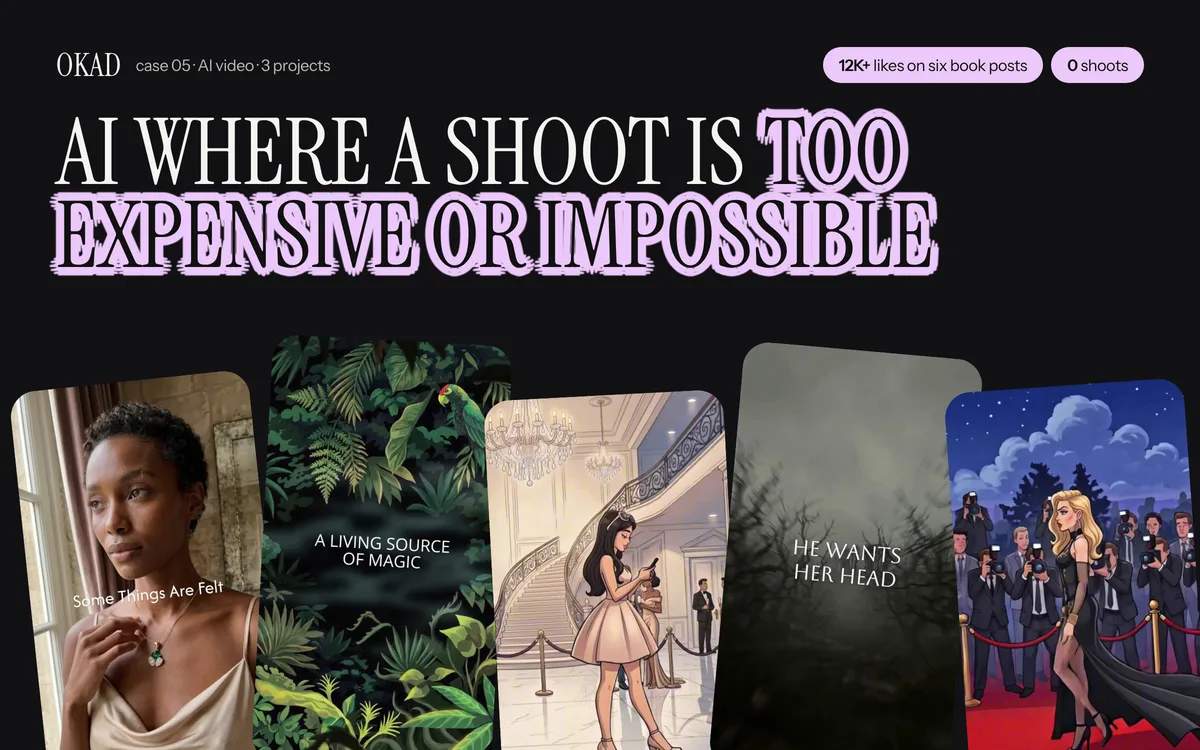
OKAD runs both illustrated and UGC formats under one retainer — testing longevity, rotating winners, and replacing fatigued creatives without production gaps. See the full case study.
Work With OKAD
OKAD produces illustrated and animated ad creatives as part of a full creative strategy service — research, briefs, production, and testing in one retainer. No per-asset pricing. No retainer lock-in.
See pricing and book a call · Or email olga@okad.agency with your monthly ad spend and goals.
Questions people ask
Do cartoon ads last longer than UGC ads?
It depends on the format. Illustrated static ads typically run 9-19 days before fatiguing on Meta — they earn attention through novelty, and novelty wears off. UGC situational photos with personal stories can hold rotation for 40-200+ days because the trust signal remains relevant longer. The longevity advantage of cartoon ads is not duration — it is production speed. You can replace a fatigued cartoon in hours, while replacing UGC requires new creator shoots.
Should I replace UGC with cartoon ads?
No. The strongest ad accounts run both formats simultaneously. Cartoon ads serve a different function than UGC — they create pattern interrupts and expand reach to new audiences, while UGC builds trust and drives direct-response conversions. Replacing one with the other weakens your creative mix. Add cartoon as a new visual type alongside your existing UGC.
How do I know when to add cartoon ads to my creative mix?
Three signals: your UGC ads are fatiguing faster than you can produce replacements, your competitor set all uses the same visual style so there is no pattern interrupt in the feed, or you sell a product whose benefits are hard to photograph — supplements, compression wear, fintech, or anything where the value is invisible. If any of these apply, cartoon format is worth testing.
Why do cartoon ads fatigue faster than UGC?
Cartoon ads earn attention through visual novelty — they look different from everything else in the feed. Once the audience has seen the style, the novelty fades and the pattern interrupt weakens. UGC earns attention through relatability and trust, which do not decay as quickly. The trade-off is that cartoon ads are dramatically cheaper and faster to produce, so you can replace them more frequently.
What is the best format mix for paid social ads?
There is no universal ratio, but a strong starting point is 50-60% UGC and live-action for direct response, 20-30% illustrated and cartoon formats for reach and novelty, and 10-20% hybrid formats like cartoon hooks on UGC bodies. Test this mix for 30 days, then adjust based on which formats drive the lowest CPA and longest rotation in your specific account.