Analytics Pitch Deck: Data to Visual Storytelling
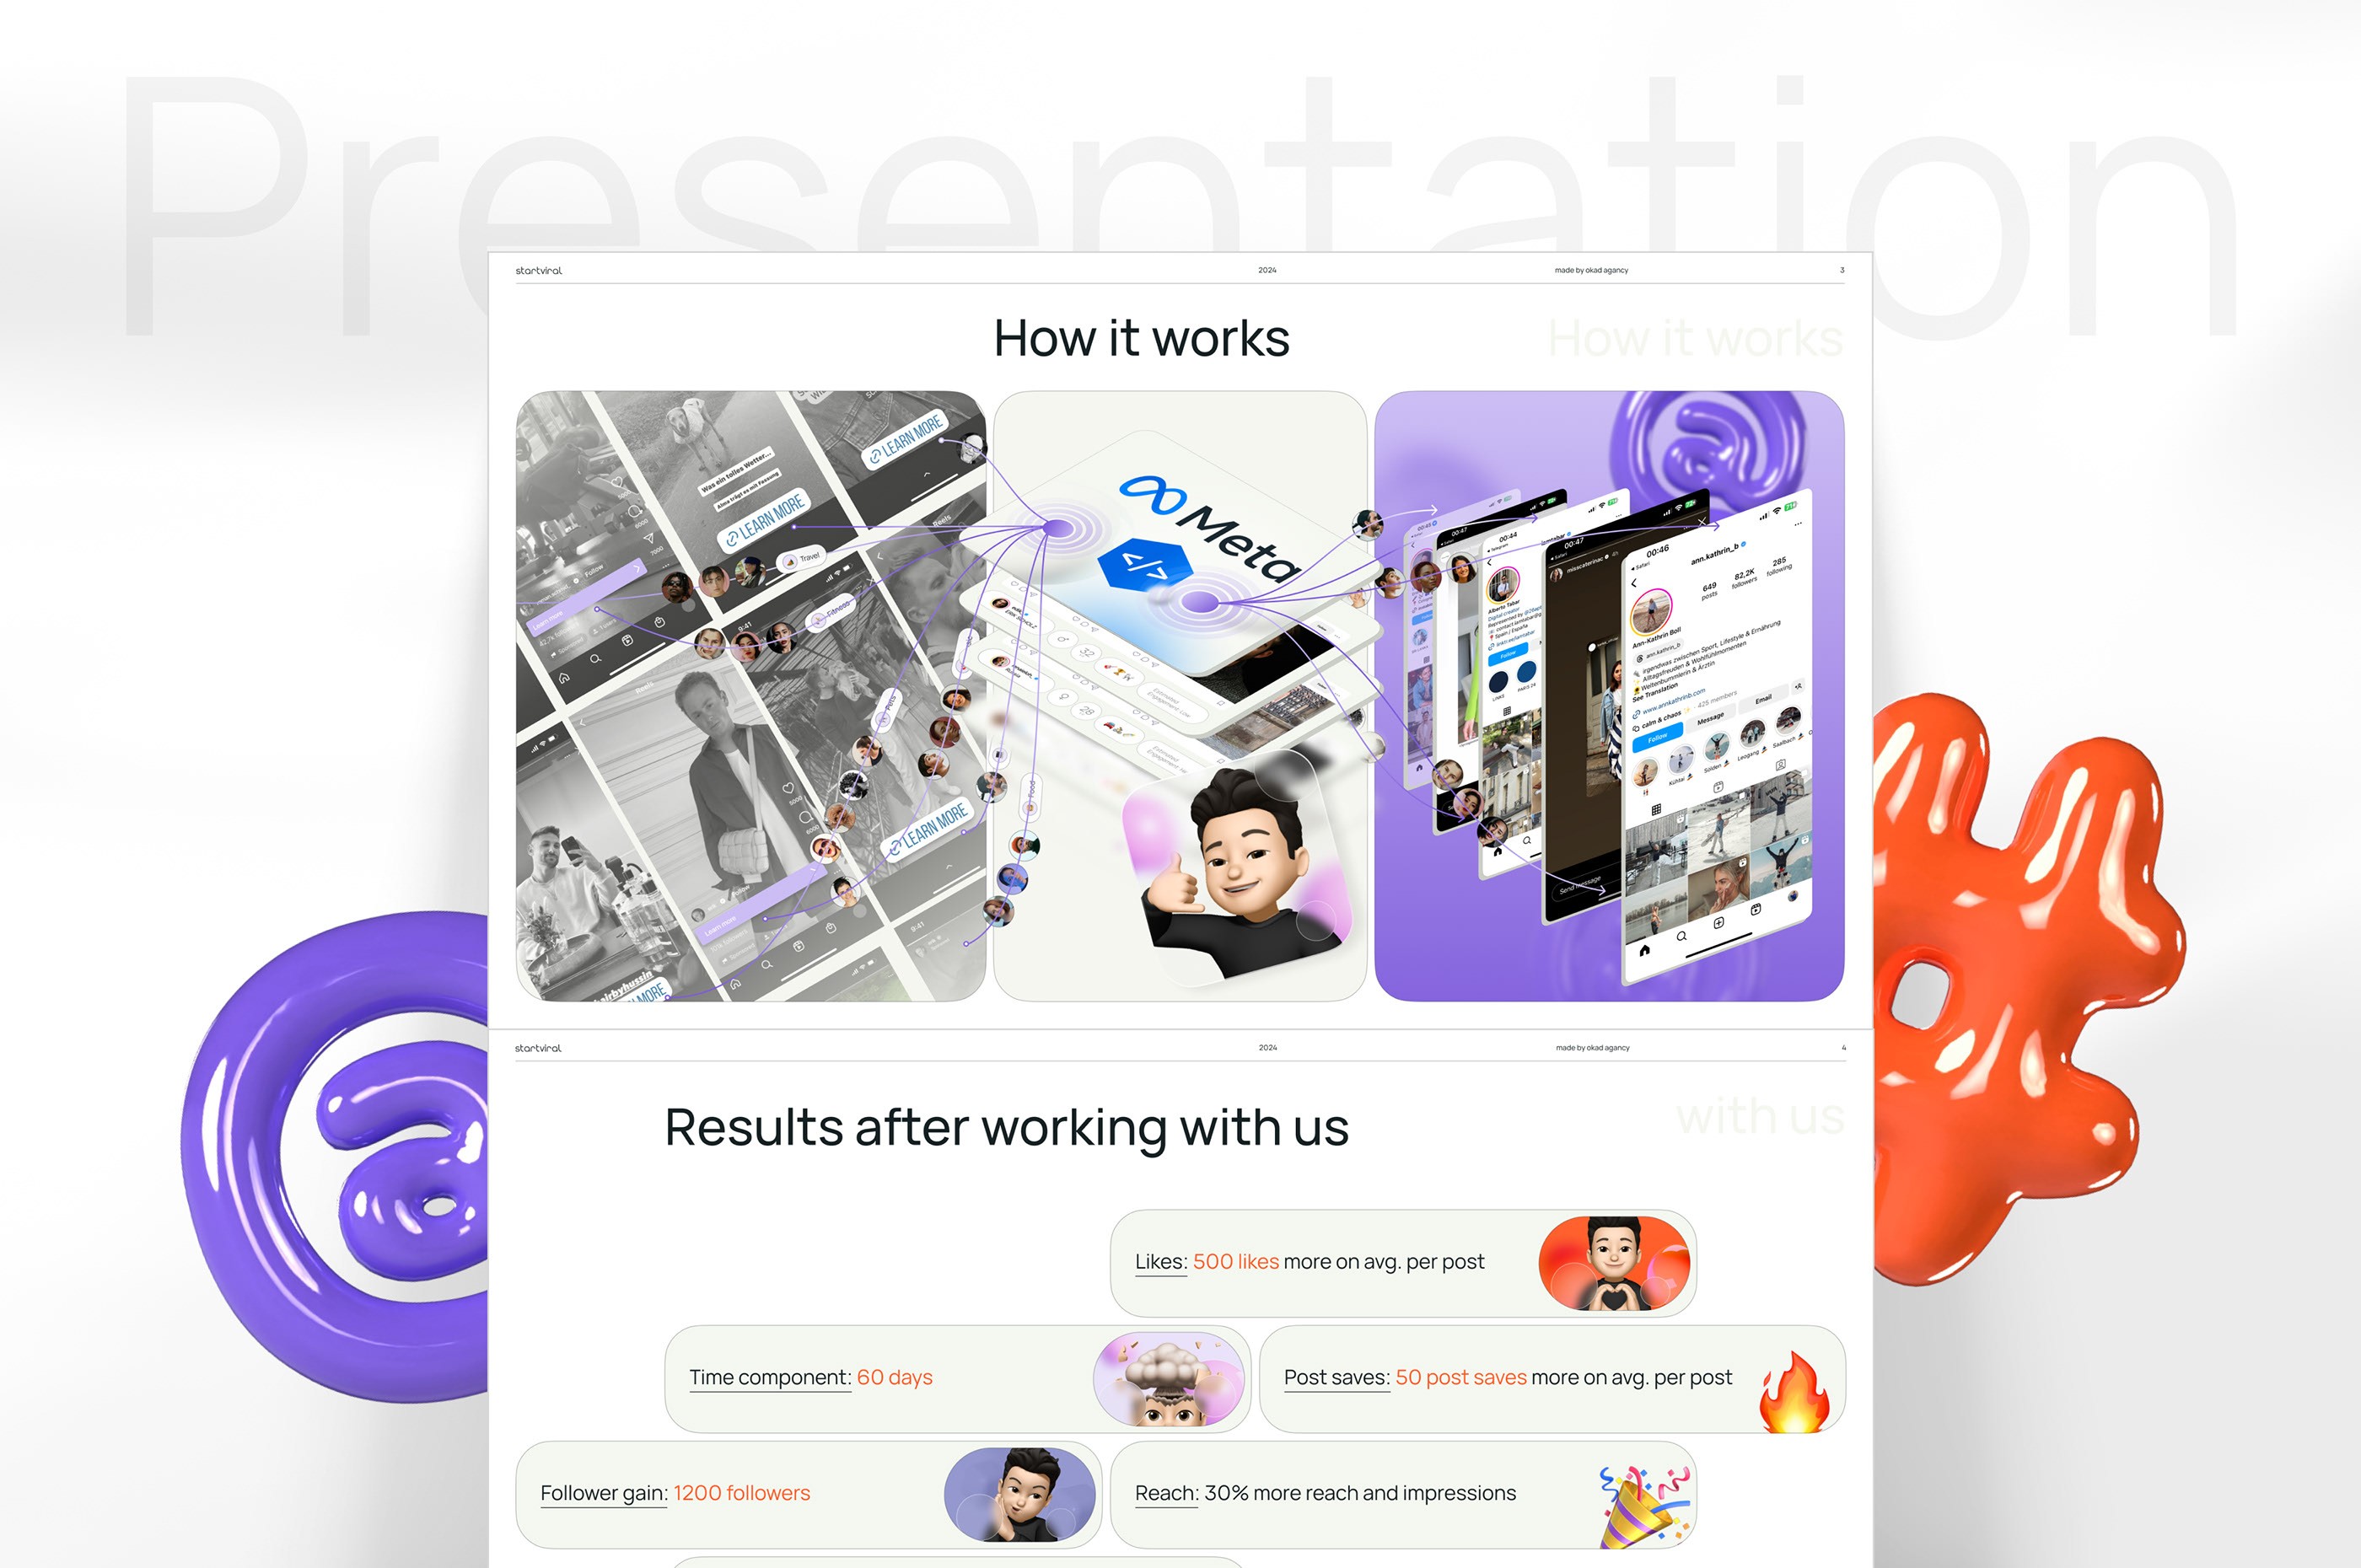
Star Viral is a startup offering a platform for comprehensive marketing and advertising analytics, integrating data from ad sources with Instagram targeting tools. They needed a pitch deck that would make their technically complex product immediately understandable to investors and potential clients.
The Challenge
Star Viral’s platform does powerful things — but its “black box” analytics functionality was difficult to explain. The core challenge was communicating intricate technical features in a digestible, visually compelling way without oversimplifying the product’s capabilities.

Our task was to build a deck that would spark interest from both investors and potential clients, clearly showing the practical benefits and competitive advantages of the platform. The founders had been presenting with a text-heavy slide set that buried the product’s value under technical jargon. Investors were losing interest by slide three.
Our Process
Before opening any design tool, we spent a full working session with the Star Viral team to understand the product architecture, competitive landscape, and the specific investor audience they were pitching. We identified three core messages the deck needed to land:
- How the platform collects and unifies data from multiple ad sources
- Why its Instagram targeting engine outperforms manual approaches
- The business model and revenue potential
With these anchors, we outlined a 15-slide narrative arc: problem, market size, solution walkthrough, competitive comparison, traction, and ask. Each slide had one job — one key takeaway — with supporting visuals doing the heavy lifting.
The Solution
We approached the project with a strategy focused on clarity, simplicity, and visual storytelling. Instead of listing features, we developed a logical structure that walks the viewer through the platform’s capabilities intuitively.

- Visualizing the Complex — We created detailed visual slides to explain Star Viral’s analytics engine. Custom graphics and flow diagrams showed how the data analysis and targeting features set it apart from competitors. Rather than describing what happens inside the platform, we showed the data flow visually — from ad source to insight to action.
- Emphasizing Key Data — We visualized key statistics and comparative data showing ROI improvements and targeting efficiency. Infographics demonstrated potential business savings and highlighted the platform’s unique advantages.
- Simple but Impactful Design — Minimalist elements with contrasting typography, deep blue tones, and clean layouts conveyed professionalism and technological credibility. The dark palette was chosen deliberately — it signals sophistication in the analytics space and provides strong contrast for data visualizations.
- Iterative Refinement — Every slide went through multiple revision cycles with the founders, striking the right balance between technical detail and visual simplicity. We went through four rounds of feedback, with the most significant changes happening on the competitive comparison and pricing slides.

What Made This Project Unique
Analytics platforms are notoriously hard to pitch because the value is invisible — it lives in data processing pipelines, not in a user interface someone can screenshot. Our approach was to make the invisible visible through custom flow diagrams that traced a single data point from ingestion to actionable insight. This “follow the data” storytelling technique gave investors a concrete mental model of what the platform actually does, without requiring them to understand the underlying technology. We have applied similar techniques across other pitch deck projects, including the Koster startup deck and the LingoCulture EdTech presentation.
Results
The final pitch deck effectively communicated Star Viral’s platform value at a glance: innovative, efficient, and differentiated in the marketing analytics space. The visual clarity and persuasive messaging made it easy for investors and clients to understand the platform’s benefits quickly.

Star Viral’s team used the deck immediately for investor meetings, receiving overwhelmingly positive feedback on how the presentation made complex technical details accessible and engaging. The founders reported that investors now understood the product within the first five minutes — a marked improvement over previous pitch attempts where technical explanations consumed most of the meeting time.


Frequently Asked Questions
How do you make a technical SaaS product understandable in a pitch deck?
We use custom flow diagrams and infographics to visualize how the platform works step by step, replacing technical jargon with clear graphics that any audience can follow.
What should a marketing analytics pitch deck focus on?
Lead with measurable ROI and competitive advantages. Investors want to see data on user acquisition costs, targeting efficiency, and platform differentiation.
How many iterations does a startup pitch deck typically go through?
Usually 3-5 rounds of refinement. We work closely with founders to balance technical accuracy with visual simplicity on every slide.
Like this work?
Let's discuss your project — we'll prepare a strategy and estimate within 48 hours.
Book a Call